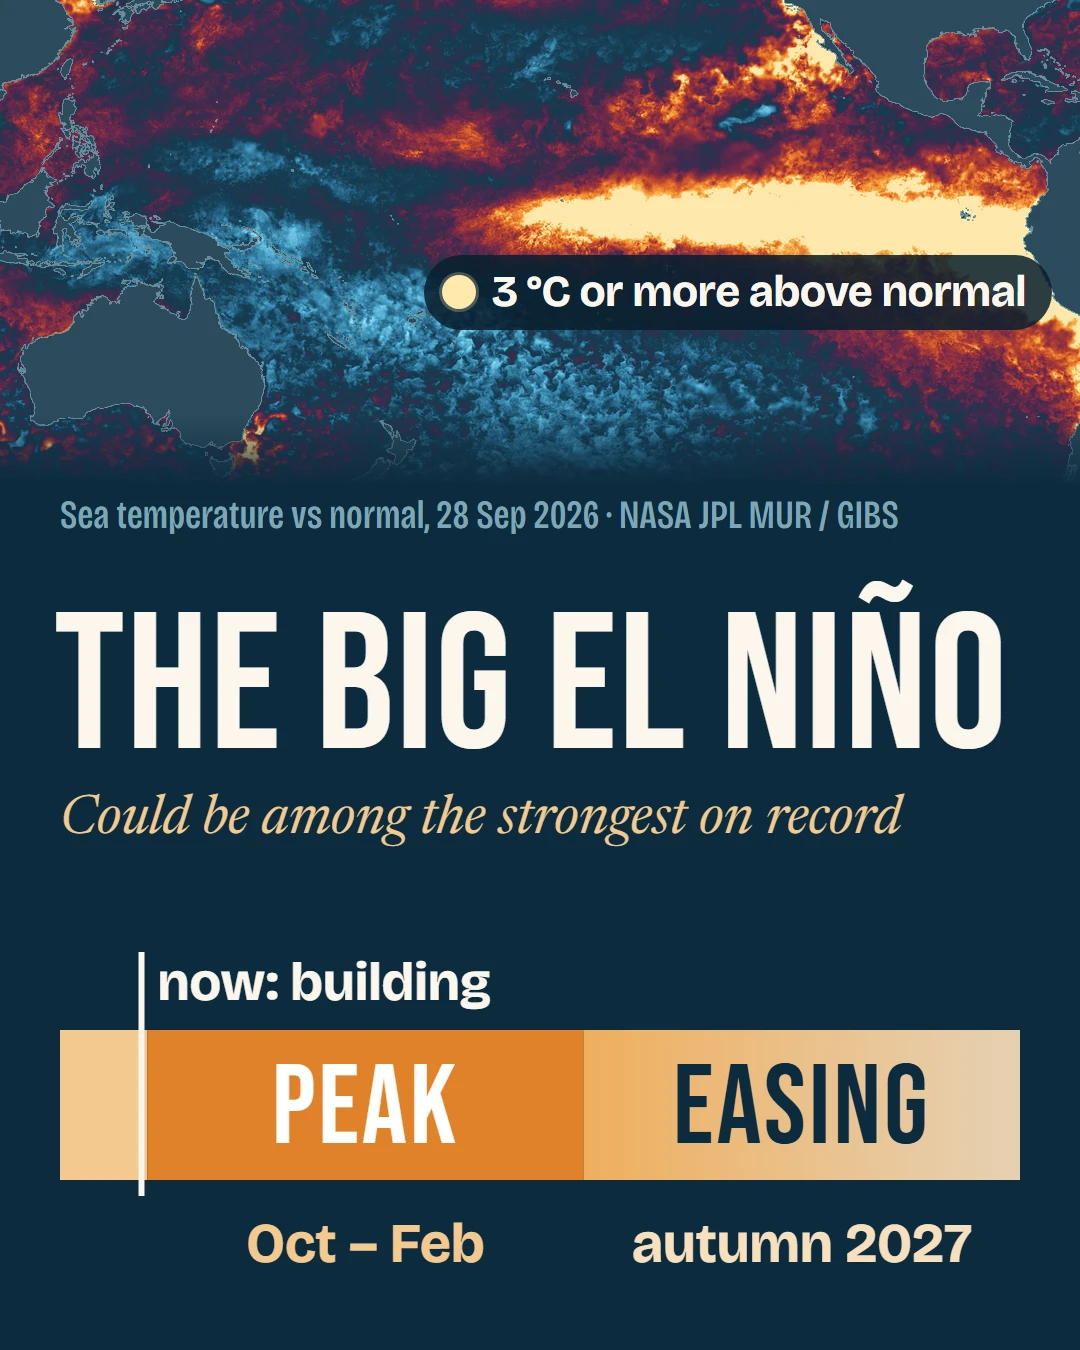
What to expect, and when.
From the forecast models as of 21 Sep 2026. Most keep El Niño going into autumn 2027; the end date is the least certain part.
The app doesn’t use El Niño at all. Each morning’s forecast still comes from the swell and wind that are actually on the way.
How it works, where it stands, and the evidence behind each line above.
ENSO stands for El Niño–Southern Oscillation. It’s a natural swing in the tropical Pacific, with the ocean and the winds above it pushing each other along. It tips one way or the other every two to seven years, and an event usually lasts about a year.
Tap through the three states:
NeutralThe trade winds blow from east to west along the equator. They push warm surface water over to our side of the Pacific and draw cold water up from the deep off South America. The warm water heats the air above it; the air rises and makes cloud and rain near Australia.
El NiñoThe trade winds weaken. The warm water sloshes back east across the Pacific, and the rising air and rain clouds follow it, away from Australia. Eastern Australia tends to turn drier and sunnier.
La NiñaThe reverse: stronger trade winds, more warm water banked up near us, more cloud and rain. The wet years of 2020 to 2023 were a rare run of three La Niñas in a row.
A slice along the equator, from Australia to South America. Not to scale: the warm layer is only a couple of hundred metres deep, across an ocean about 15,000 km wide.
The “Southern Oscillation” is the air half of the see-saw: a swing in air pressure between Tahiti and Darwin, tracked by the Southern Oscillation Index (SOI). Strongly negative means the atmosphere has joined in with an El Niño; strongly positive, a La Niña.
The ocean half is watched in a strip of the equator roughly halfway between Australia and South America, called Niño‑3.4. When that strip runs well above normal for months, and the winds and the air pressure join in, forecasters call it an El Niño.
Forecasters generally call +1.5 °C strong and +2.0 °C very strong. A single week reads higher than a monthly average, so compare like with like. Figures: IRI, 21 Sep 2026.
Chance of El Niño conditions in each three-month season, from Sep–Nov 2026 to May–Jul 2027. Source: IRI, 21 Sep 2026.
All 22 models in the IRI’s survey have it strengthening further. The peak is expected between October and February, then a fairly quick fade through autumn and winter 2027: big El Niños tend to collapse soon after they peak. “Among the strongest on record” is the forecasters’ language, and it means could, not will.
El Niño is one of the biggest influences on eastern Australian rain from winter to spring. By summer its hold on the NSW coast is weaker.
Fewer clouds mean more sunshine and warmer days, and as the land dries out the bushfire risk climbs. If smoke drifts over the beach, the app’s air-quality tile will show it.
The strength of an El Niño doesn’t set the size of its effect here. The huge 1997–98 event dried Australia far less widely than the weak one of 2002–03, which brought severe drought. It loads the dice; it doesn’t throw them.
Here the honest answer is a couple of tendencies, and some things El Niño doesn’t tell you at all.
This is about the ground swell: the longer, regular waves made by storms far away, which dominate Sydney’s wave records. The chop the local wind raises in the bay is a different thing (see Wind and chop, below).
Studies of Sydney’s wave records, going back decades, find that El Niño years tend to bring slightly smaller waves, arriving more from the south, with fewer big storms such as east coast lows. La Niña years swing the other way: more swell from the east and north-east, and more beach erosion along the coast.
Cabbage Tree Bay to scale, north up. The pale wedge is the bay’s straight line to open ocean, NNE to E. Blue: La Niña years bring swell from the east more often, and it comes straight in. Orange: El Niño years bring swell from the south more often, and it has to bend round Shelly to get in (in two years of NSW Nearshore data, a swell from about 157° reaches the bay mouth from about 124°). A shift in how often, across whole seasons, not a forecast. Map data © OpenStreetMap contributors.
From Cabbage Tree Bay, open ocean lies in a straight line only from about north-north-east to east. Sydney’s usual south-easterly swell has to bend round Shelly headland to get in: in two years of NSW Nearshore wave data, a swell from about 157° reaches the bay mouth from about 124°. So El Niño’s lean is towards swell that has to bend in, and La Niña’s towards swell that comes straight in.
Hotter, sunnier days strengthen the afternoon sea breeze, and here that is the nor’easter: it crosses about 6 km of open sea before it reaches the bay, so it builds more chop than most winds. But El Niño also weakens the easterly flow off the Pacific that brings onshore weather to the NSW coast. We found no study that measures which wins at Manly. The app’s chop reading follows the wind forecast each day either way.
This is the one people expect El Niño to decide, and it doesn’t. The water off Manly is set mostly by the East Australian Current, whose warm eddies come and go over weeks, and by cold water drawn up from below when strong north-easterlies blow along the coast. Those swings dwarf anything El Niño does to the average here.
The Tasman Sea’s record marine heatwave of 2015–16, up to 2.9 °C above normal for 251 days, happened during a very strong El Niño. The scientists who studied it traced it to the current, not to El Niño. The Tasman is warming about twice as fast as the global average, whatever the Pacific is doing. For the water temperature, trust the sea-temp tile, not the season.
One thing El Niño may nudge is the cold snaps. A 14-year satellite study of the south-east coast found that El Niño years tend to strengthen upwelling along NSW, a low-to-moderate effect, and around Sydney upwelling comes and goes, mostly with northerly winds. So a few more cold mornings after nor’easter days is plausible. It is a tendency, not a forecast.
Fewer heavy downpours would mean fewer mornings when stormwater runs into the bay. But it takes only one storm, so after heavy rain, check Beachwatch in any season.
We know of no research linking El Niño to bluebottle numbers here. They arrive on onshore winds: a UNSW study of Sydney beaches found north-easterlies, the afternoon sea breeze included, and south-easterlies bring the most. If El Niño changes how often those blow, bluebottle numbers could change with them, but nobody has tested it. The app’s bluebottle warnings follow the wind and your reports.
A big El Niño releases a lot of the Pacific’s stored heat into the air. The years after the big peaks of 1997–98, 2015–16 and 2023–24 each set a global heat record (1998, 2016 and 2024), which puts 2027 in contention. Warm oceans worldwide also raise the risk of coral bleaching, including on the Great Barrier Reef.
And after it? Big El Niños have sometimes been followed by La Niña within a year, as in 1998 and 2010. It’s far too early to call that for 2027.
Tap to open · Nine terms
Tap to open · Where every number comes from
Numbers are as published on the dates above and will change as the event develops.